Home > Blog Learn SEO with Seotwix Our SEO experts regularly create relevant SEO insights where you can learn optimization tips and implement them to make your website grow following the expertise of Seotwix, a well-known SEO company that provides exceptional SEO services. July 24, 2026 Uncovering the Hidden Traffic Sources Your Analytics Can’t See Read the full article Blog categoriesPick a category you’d like to read articles about. SEO Learn SEO with articles from our experts. Reddit Learn Reddit platform from the best Reddit marketers. Marketing Learn how to do marketing in 2025. How to fix Find all the solutions to keep your website healthy. Industry-specific blog postsPick an industry you are interested in to read articles and find marketing secrets. Flooring Marketing Discover fresh and proven marketing tips for flooring businesses. Lawyer SEO Learn how to improve SEO of your law firm's website. Construction SEO Learn how to improve SEO for your business website if you are in the construction industry. Local SEO articlesLooking for local SEO tips? Our Chicago-based team writes articles on relevant local search marketing topics. Chicago SEO articles For those looking for tips on how to improve local SEO in Chicago . Latest posts Marketing Uncovering the Hidden Traffic Sources Your Analytics Can’t See Yulian Fediukov July 24, 2026 SEO What Backlinks Work Better for Law Firms (2026) Yulian Fediukov April 5, 2026 Marketing Shopify and SaaS: The Part Nobody Warns You About Yulian Fediukov February 1, 2026 Marketing Scaling Visual Consistency Without a Dedicated Iconographer Yulian Fediukov December 20, 2025 Reddit Marketing Hub How to Use Reddit for SEO: Threads, Comments, and Rankings Yulian Fediukov December 15, 2025 Marketing Pro Tips on How to Prepare a Website for High-Traffic Events Yulian Fediukov December 5, 2025 Marketing The Modern Playbook for Scaling Online Stores Successfully Yulian Fediukov November 25, 2025 Reddit Marketing Hub What is a Subreddit? Simple words explanation in 2025 Yulian Fediukov November 20, 2025 Marketing The most widespread errors in popunder ads and how to fix them Yulian Fediukov November 14, 2025 Reddit Marketing Hub CQS Reddit: What It Is, Why Marketers Need It, & How to Improve It Yulian Fediukov November 10, 2025 Reddit Marketing Hub Reddit Marketing: New Era of Search & Community Marketing Yulian Fediukov November 5, 2025 Marketing What Is a SaaS App and Why Your Business Might Need One Yulian Fediukov October 10, 2025 Page1 Page2 Page3 Page4 Page5 Page6 Page7 Page8 Page9 Page10 Page11 Page12 Page13 Page14 Page15 Page16 Page17
Marketing Uncovering the Hidden Traffic Sources Your Analytics Can’t See Yulian Fediukov July 24, 2026
Marketing Scaling Visual Consistency Without a Dedicated Iconographer Yulian Fediukov December 20, 2025
Reddit Marketing Hub How to Use Reddit for SEO: Threads, Comments, and Rankings Yulian Fediukov December 15, 2025
Marketing Pro Tips on How to Prepare a Website for High-Traffic Events Yulian Fediukov December 5, 2025
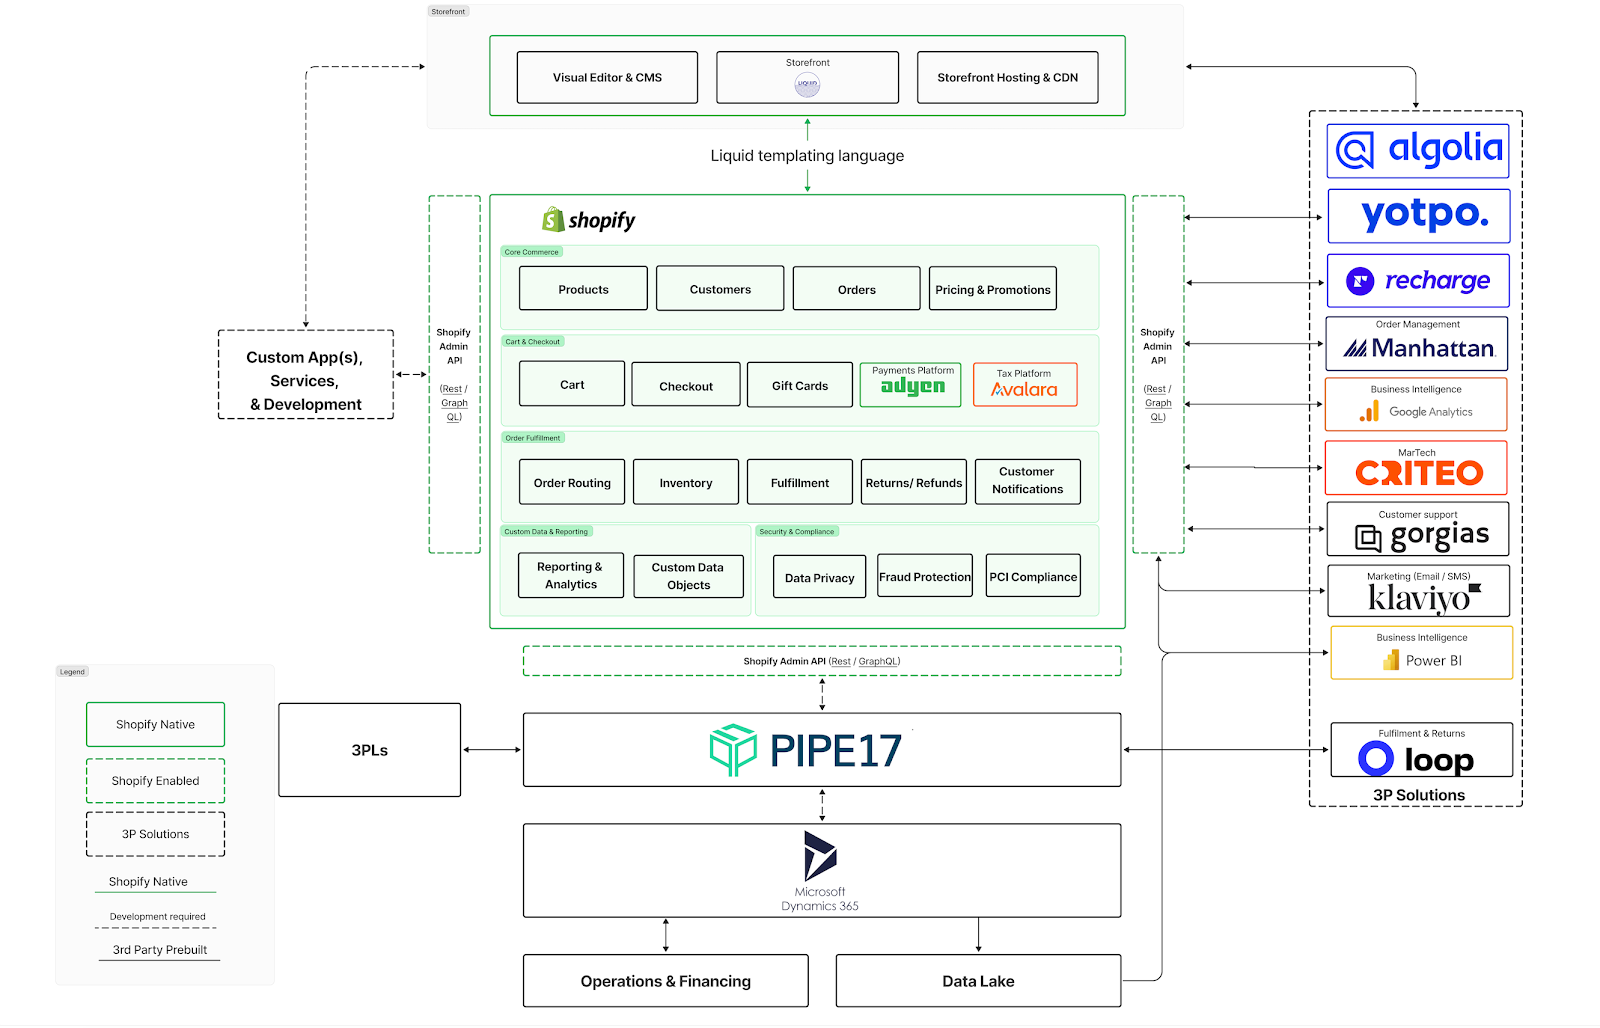
Marketing The Modern Playbook for Scaling Online Stores Successfully Yulian Fediukov November 25, 2025
Reddit Marketing Hub What is a Subreddit? Simple words explanation in 2025 Yulian Fediukov November 20, 2025
Marketing The most widespread errors in popunder ads and how to fix them Yulian Fediukov November 14, 2025
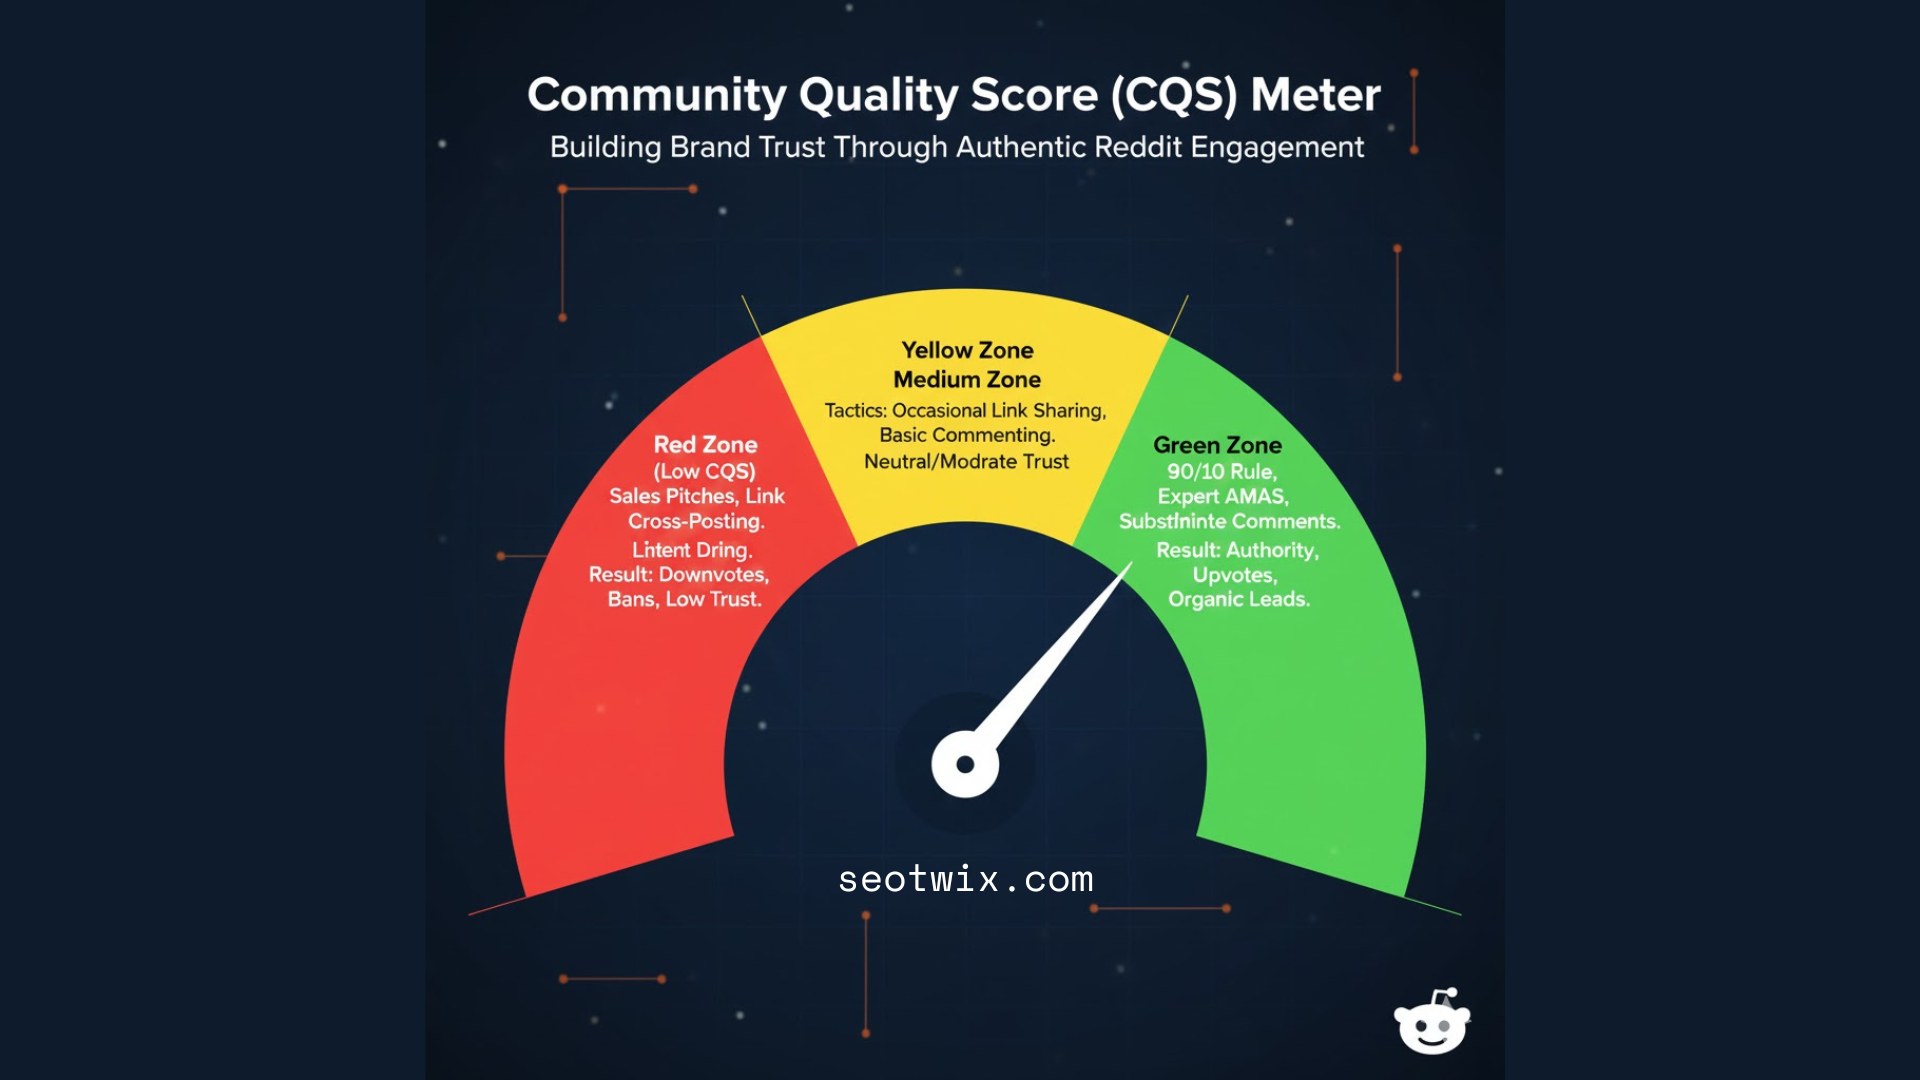
Reddit Marketing Hub CQS Reddit: What It Is, Why Marketers Need It, & How to Improve It Yulian Fediukov November 10, 2025
Reddit Marketing Hub Reddit Marketing: New Era of Search & Community Marketing Yulian Fediukov November 5, 2025